TL;DR Quick Answers
Excel Recipe Inventory Template
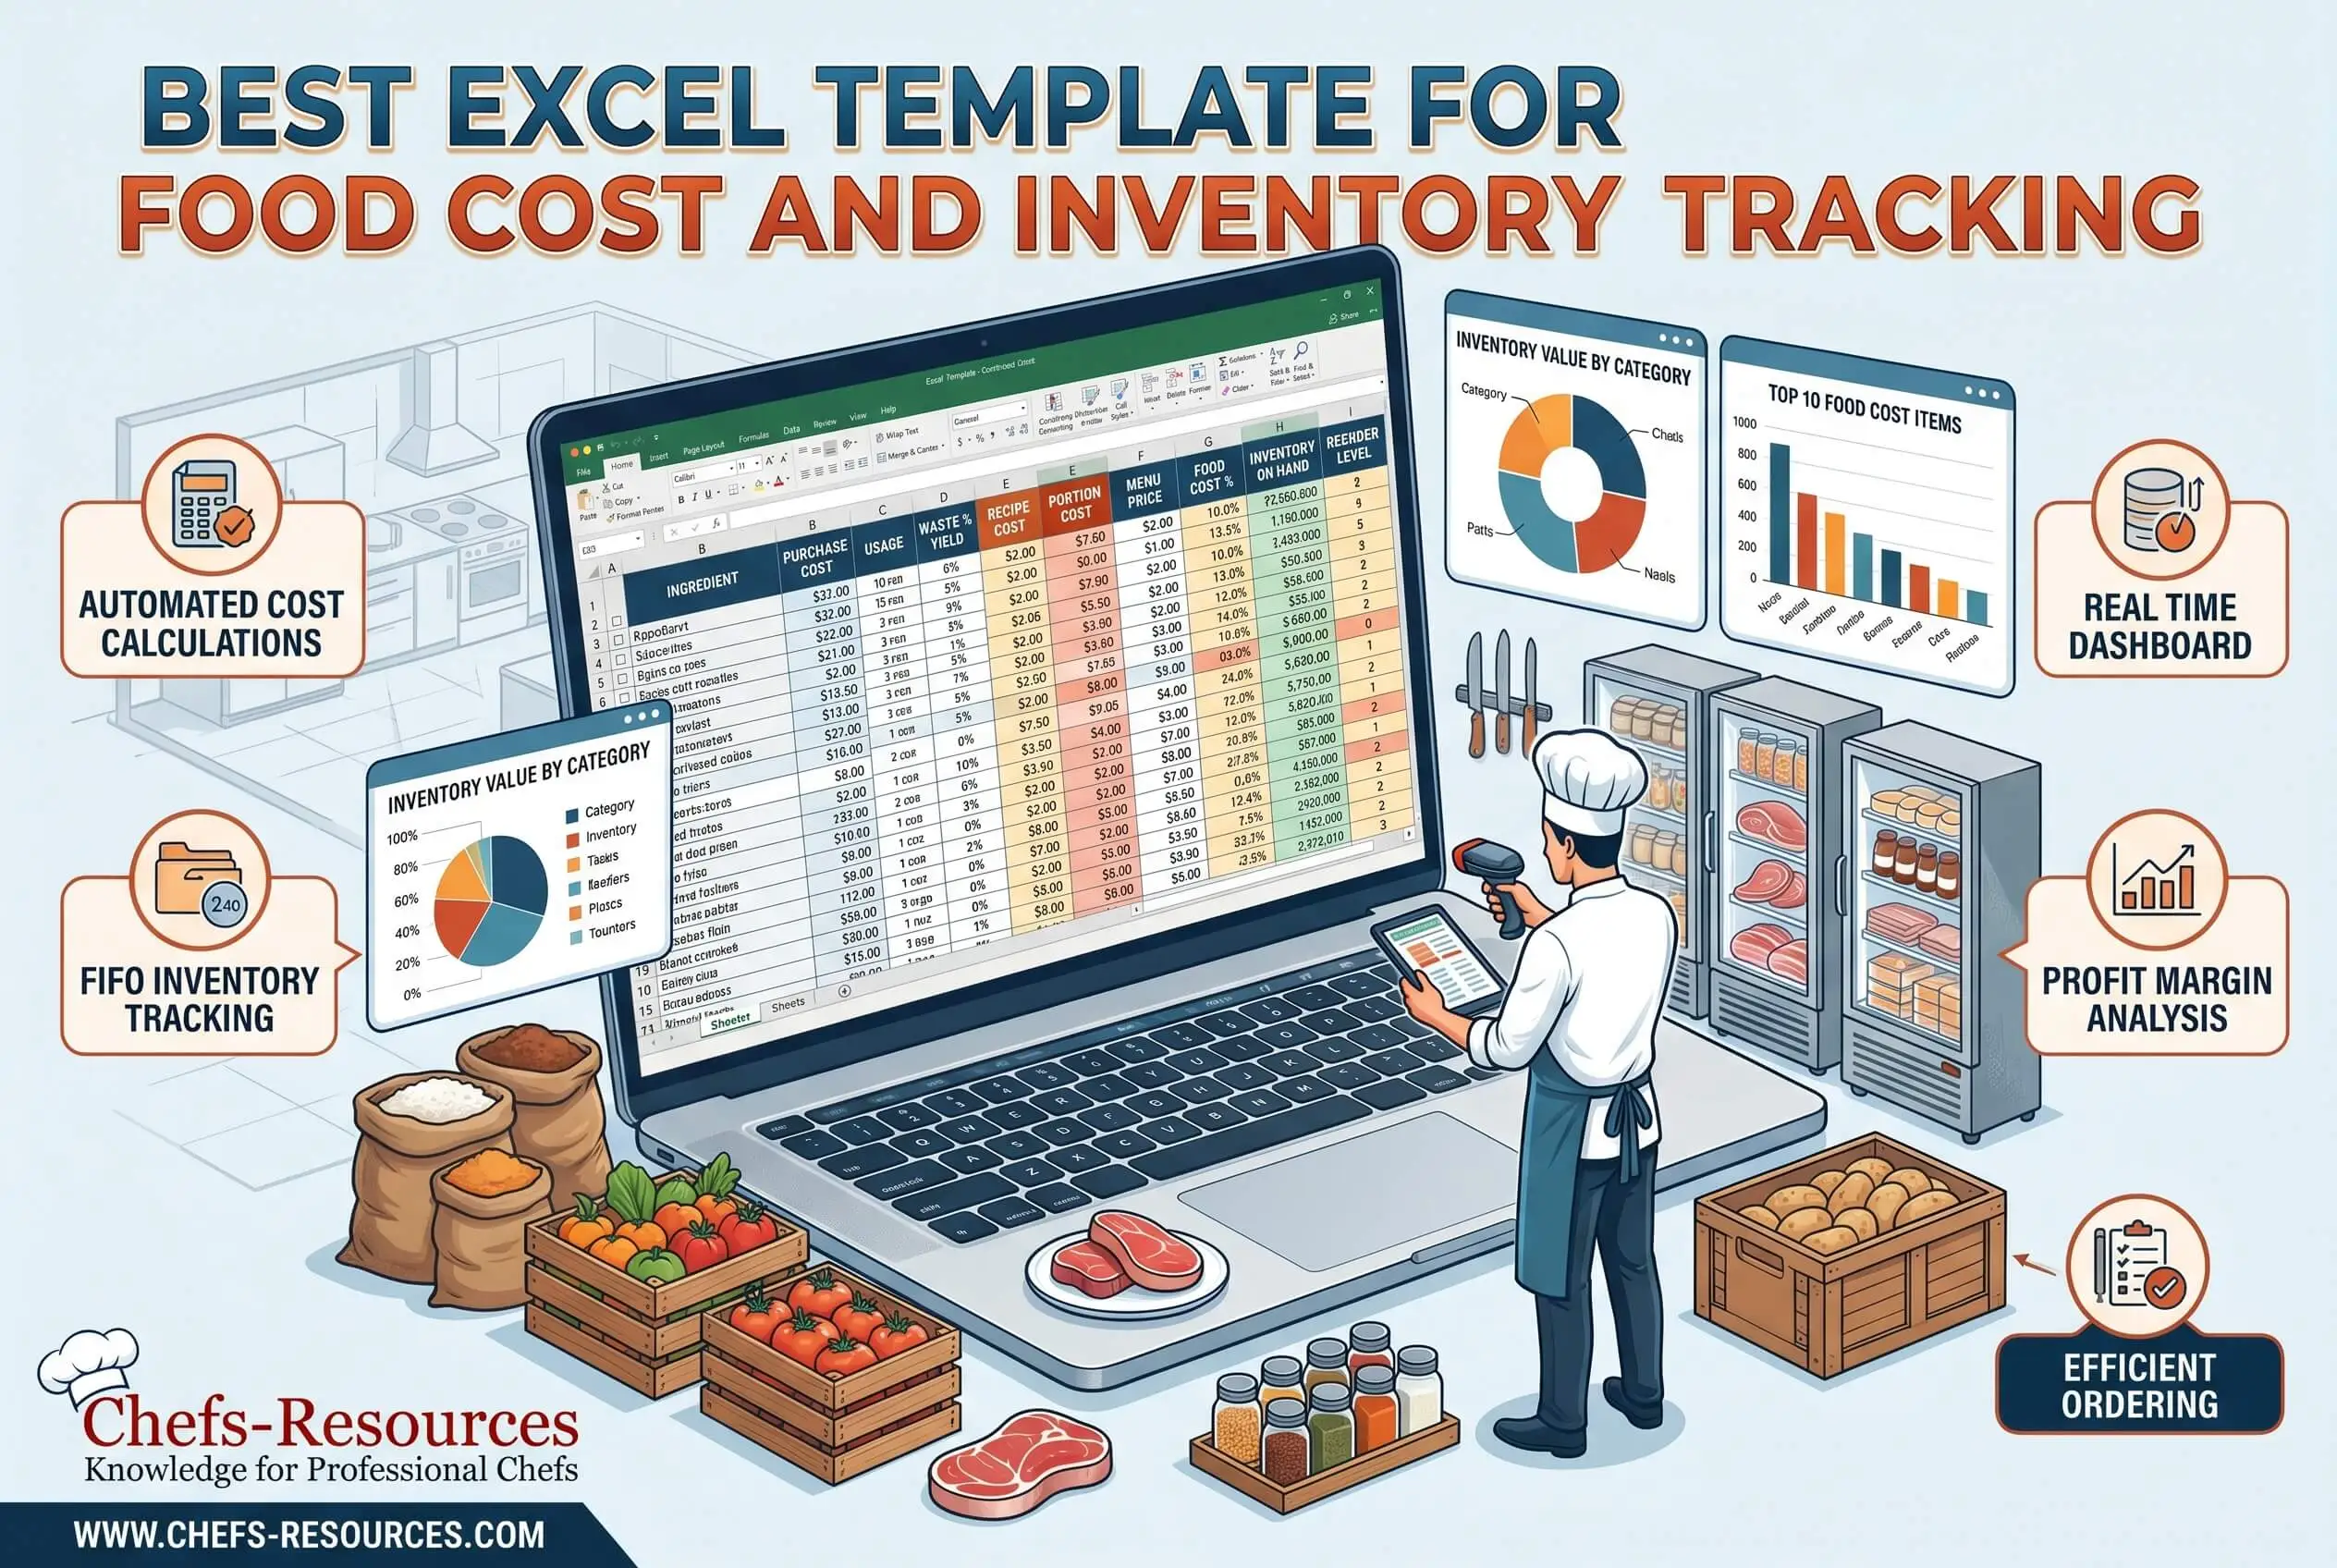
An Excel recipe inventory template is a spreadsheet that connects recipe costing, ingredient inventory, and food cost reporting in one file. The working version links four sheets:
Recipe cards: per-dish ingredient list, yield, portion size, calculated plate cost
Master ingredient list: unit of measure, as-purchased cost, supplier, yield percentage, edible portion cost
Inventory and par levels: current count, variance, reorder trigger
Weekly reporting roll-up: food cost percentage, top cost drivers, theoretical vs actual variance
Update a unit price once on the master list and every recipe card recalculates automatically. Most small kitchens run the file in about fifteen minutes a week. The variance line between theoretical and actual food cost is the signal that tells you the system is working — and the number that pays back the time you spend on it.
Top Takeaways
A working excel recipe inventory template links recipe cards to a master ingredient list, so unit price changes flow through automatically.
Food cost percentage is the number you're optimizing for. Most full-service kitchens land between 28 and 32 percent of sales, and the right template makes that number visible every week instead of every month.
Yield percentage and edible portion cost matter more than as-purchased cost when you price the menu. You never serve what you paid for. Trim, peel, and natural waste account for the difference, and the master ingredient list is where you build that into the math.
Weekly inventory counts and clear par levels keep the gap between theoretical and actual food cost from widening. The variance line is where you catch problems early.
A recipe, inside a costing system, is a yielded, portioned, cost production instruction. That's the unit every other decision in the file is built on.
What an Excel Recipe Inventory Template Actually Tracks
Build the template as four connected sheets. A unit price change on one ingredient should flow through to every recipe that uses it, and a count on the inventory sheet should feed the food cost report without you opening another tab. If the file isn't built that way, you'll be rebuilding it every quarter.
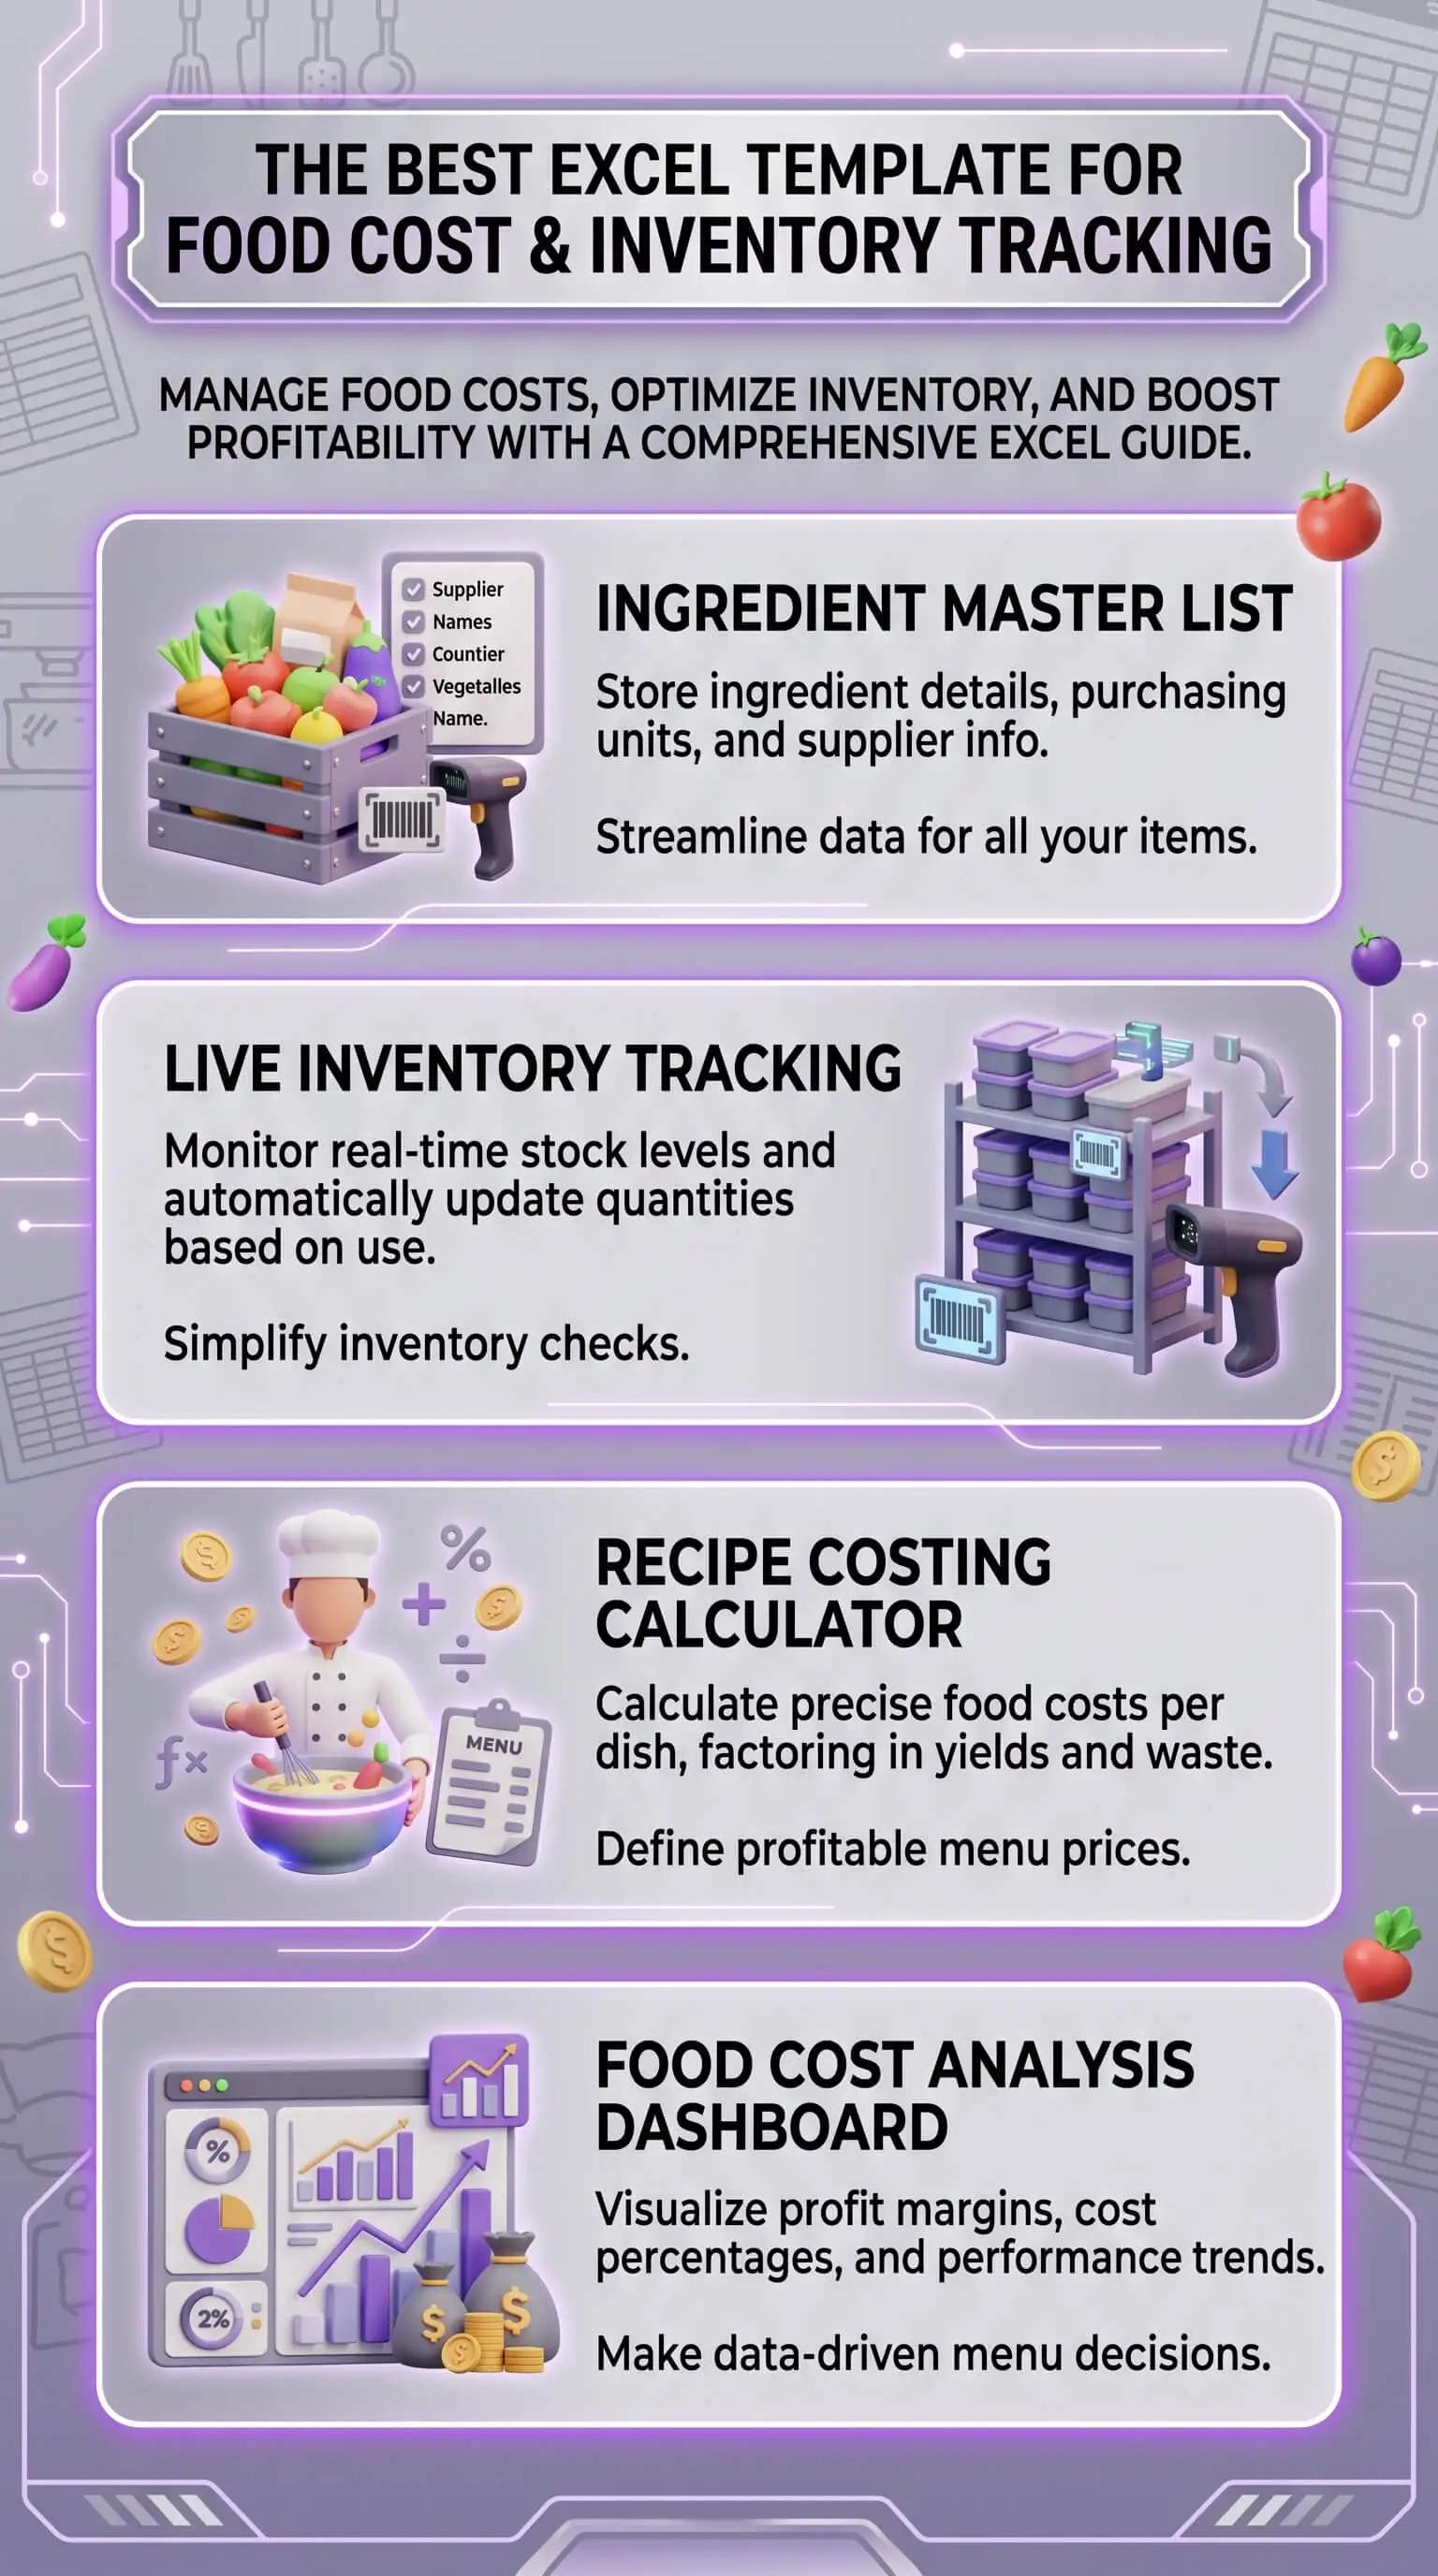
The recipe card sheet
Each card carries the ingredient list, per-ingredient quantity, recipe yield (how many portions the dish produces), portion size, and the calculated plate cost. Unit costs come from the master list. From there, the card multiplies cost by quantity, sums the lines, divides by yield, and returns the per-plate number you actually need to price the menu.
The master ingredient list
Think of this as the backbone. Every ingredient gets one row: unit of measure, as-purchased cost off your latest invoice, current supplier, yield percentage (the edible portion left after trim or peel), and the calculated edible portion cost. The master list is the only place you update unit prices. Change a number here, and every recipe card recalculates without you opening another tab.
Inventory and par levels
Each ingredient gets a par level (the minimum on-hand you need to operate without running short), alongside current count, variance, and a reorder trigger. Weekly counts feed the variance column. That column is where waste, theft, and supplier shortages show up before they get expensive.
Reporting roll-up
This sheet pulls together weekly food cost percentage, top cost drivers, and the gap between theoretical food cost (what your recipes say you should spend) and actual food cost (what your invoices and counts say you spent). That gap is the most useful number in a small kitchen. Most operators run a variance between two and five percentage points. Pulling it in by even one point shows up in the monthly P&L.
The recipe costing template excel workflow only works if the four sheets stay connected. A standalone inventory file or a one-off recipe spreadsheet without the linkage won't pay for itself.
“The kitchens that hold food cost steady use the same spreadsheet every Monday morning. The chef opens it, runs counts, looks at the variance line, and acts on what's there. That weekly habit is the actual cost-control tool, and the spreadsheet itself is just where the work lives. I've seen operators swap a working file for a thousand-dollar platform and lose ground because nobody opened the new system. The tool that gets used is the tool that's working.”
7 Essential Resources
These references help you calibrate and run the template. Some give you the data you'll plug into the file. Others give operational context for what happens in the kitchen between counts.
National Restaurant Association — Restaurant Operations Data Abstract analysis. The NRA's annual operating data report is the closest thing to an industry benchmark for food cost ratios across full-service and limited-service segments.
USDA Economic Research Service — Food Price Outlook. The ERS publishes monthly forecasts for food-at-home and food-away-from-home price changes by category. Use it to anticipate which ingredients will pressure your food cost percentage next quarter.
Smartsheet — Free Food Inventory Templates collection. A solid starting library of Excel and Google Sheets templates covering restaurant inventory, food waste tracking, and expiration monitoring.
StateFoodSafety — First In, First Out primer. A clear walkthrough of FIFO rotation, the discipline that pairs with the inventory sheet to keep both safety and waste in check.
ReFED — Consumer Food Waste Insights. ReFED's research on surplus food and waste costs is the most-cited dataset in restaurant sustainability reporting. Useful for sizing the waste-reduction opportunity in your own operation.
Top Organic Farming — Station Management Tips for Restaurant Kitchens. Internal reference on how station-level discipline (mise en place, prep volumes, par adherence) flows back into inventory accuracy and recipe consistency.
Top Organic Farming — Discover the Best Organic Farm-To-Table Experiences Near Los Angeles. Internal context for operators sourcing from local organic farms, where ingredient prices swing the most and weekly recipe costing actually pays off.
3 Statistics
Median food cost ran at 32.0 percent of sales for full-service restaurants and 32.4 percent for limited-service restaurants in 2024, according to the National Restaurant Association's analysis of higher-volume operators. That sits inside the 28 to 35 percent range most operators target as healthy.
U.S. restaurants generate roughly 11.4 million tons of food waste each year at an estimated cost of about $25 billion, per data compiled from ReFED and cited by the South Carolina Department of Environmental Services. The same source notes that every dollar invested in food waste reduction returns about $8 in cost savings.
USDA Economic Research Service forecasts food-away-from-home prices to rise 3.6 percent in 2026, slightly above the 20-year average of 3.5 percent, per the latest Food Price Outlook summary findings. That kind of continued cost pressure makes weekly recipes costing a margin-protection habit small kitchens can't afford to skip.
Final Thoughts and Opinion
A recipe inventory template is the spreadsheet that pays for itself fastest in a small kitchen. You'll eventually run other systems alongside it, but among everything competing for the Monday-morning fifteen minutes, this is the one. The operators who actually run weekly counts, update the master ingredient list against fresh invoices, and read the variance line by Friday catch problems while the problems are still small.
There's a real ceiling on this approach. Excel works well as a starting point, but kitchens running more than two hundred SKUs across multiple locations eventually graduate to dedicated software. Until you cross that threshold, a connected four-sheet file does more useful work than a fragmented stack of apps.
For kitchens sourcing from organic and farm-to-table suppliers, the math gets tighter. Higher unit prices on organic produce, smaller-supplier invoices that change weekly, and tighter substitution windows all push variance up if nobody's watching the file. Download a working template, run one week of real numbers through it, and read the variance line on Friday afternoon. The answers usually take less than ten minutes to read.
Frequently Asked Questions
What is the best Excel template for food cost and inventory tracking?
The best template links four connected sheets: recipe cards, a master ingredient list, an inventory and par level sheet, and a reporting roll-up. Unit price changes entered once on the master list should flow automatically into every recipe card and the food cost percentage report.
How do you calculate food cost percentage in Excel?
Use the formula (Beginning Inventory + Purchases minus Ending Inventory) divided by Food Sales, multiplied by 100. Most templates build this into the reporting sheet, pulling beginning and ending counts from the inventory tab and purchases from a separate invoice log.
What columns should a recipe inventory template include?
The recipe card needs ingredient name, quantity, unit, unit cost (pulled from the master list), line cost, yield, portion size, and plate cost. The master ingredient list needs unit of measure, as-purchased cost, supplier, yield percentage, and edible portion cost.
How often should a restaurant update inventory and recipe costs?
Run inventory counts weekly. Update the master ingredient list whenever an invoice changes a unit price, which in normal operations means at least once a week, and as soon as the invoice lands when suppliers are moving prices fast.
Is Excel still good for restaurant inventory, or should I use software?
Excel works well up to roughly two hundred SKUs and a single location. Past that point, dedicated inventory and recipe management software earns its cost through real-time tracking, automated alerts, and multi-site reporting.
How do I handle yield percentage and edible portion cost in a recipe template?
Add a yield percentage column to the master ingredient list. Edible portion cost equals as-purchased cost divided by yield percentage. The recipe card multiplies edible portion cost by recipe quantity, which gives you a more accurate plate cost than as-purchased cost alone.
Get Started Today
Download a working recipe inventory template and run one week of real numbers through it. Update the master ingredient list against your latest invoices, take a Monday inventory count, and look at the variance line on Friday. Accurate dry spice yields can turn that review into a positive margin habit by showing the true usable value of toasted, ground, or sifted spices before small losses add up. One week of real data says more about your kitchen's food cost discipline than any consultant report. From there, set a recurring fifteen-minute Monday review and keep the file alive every week.