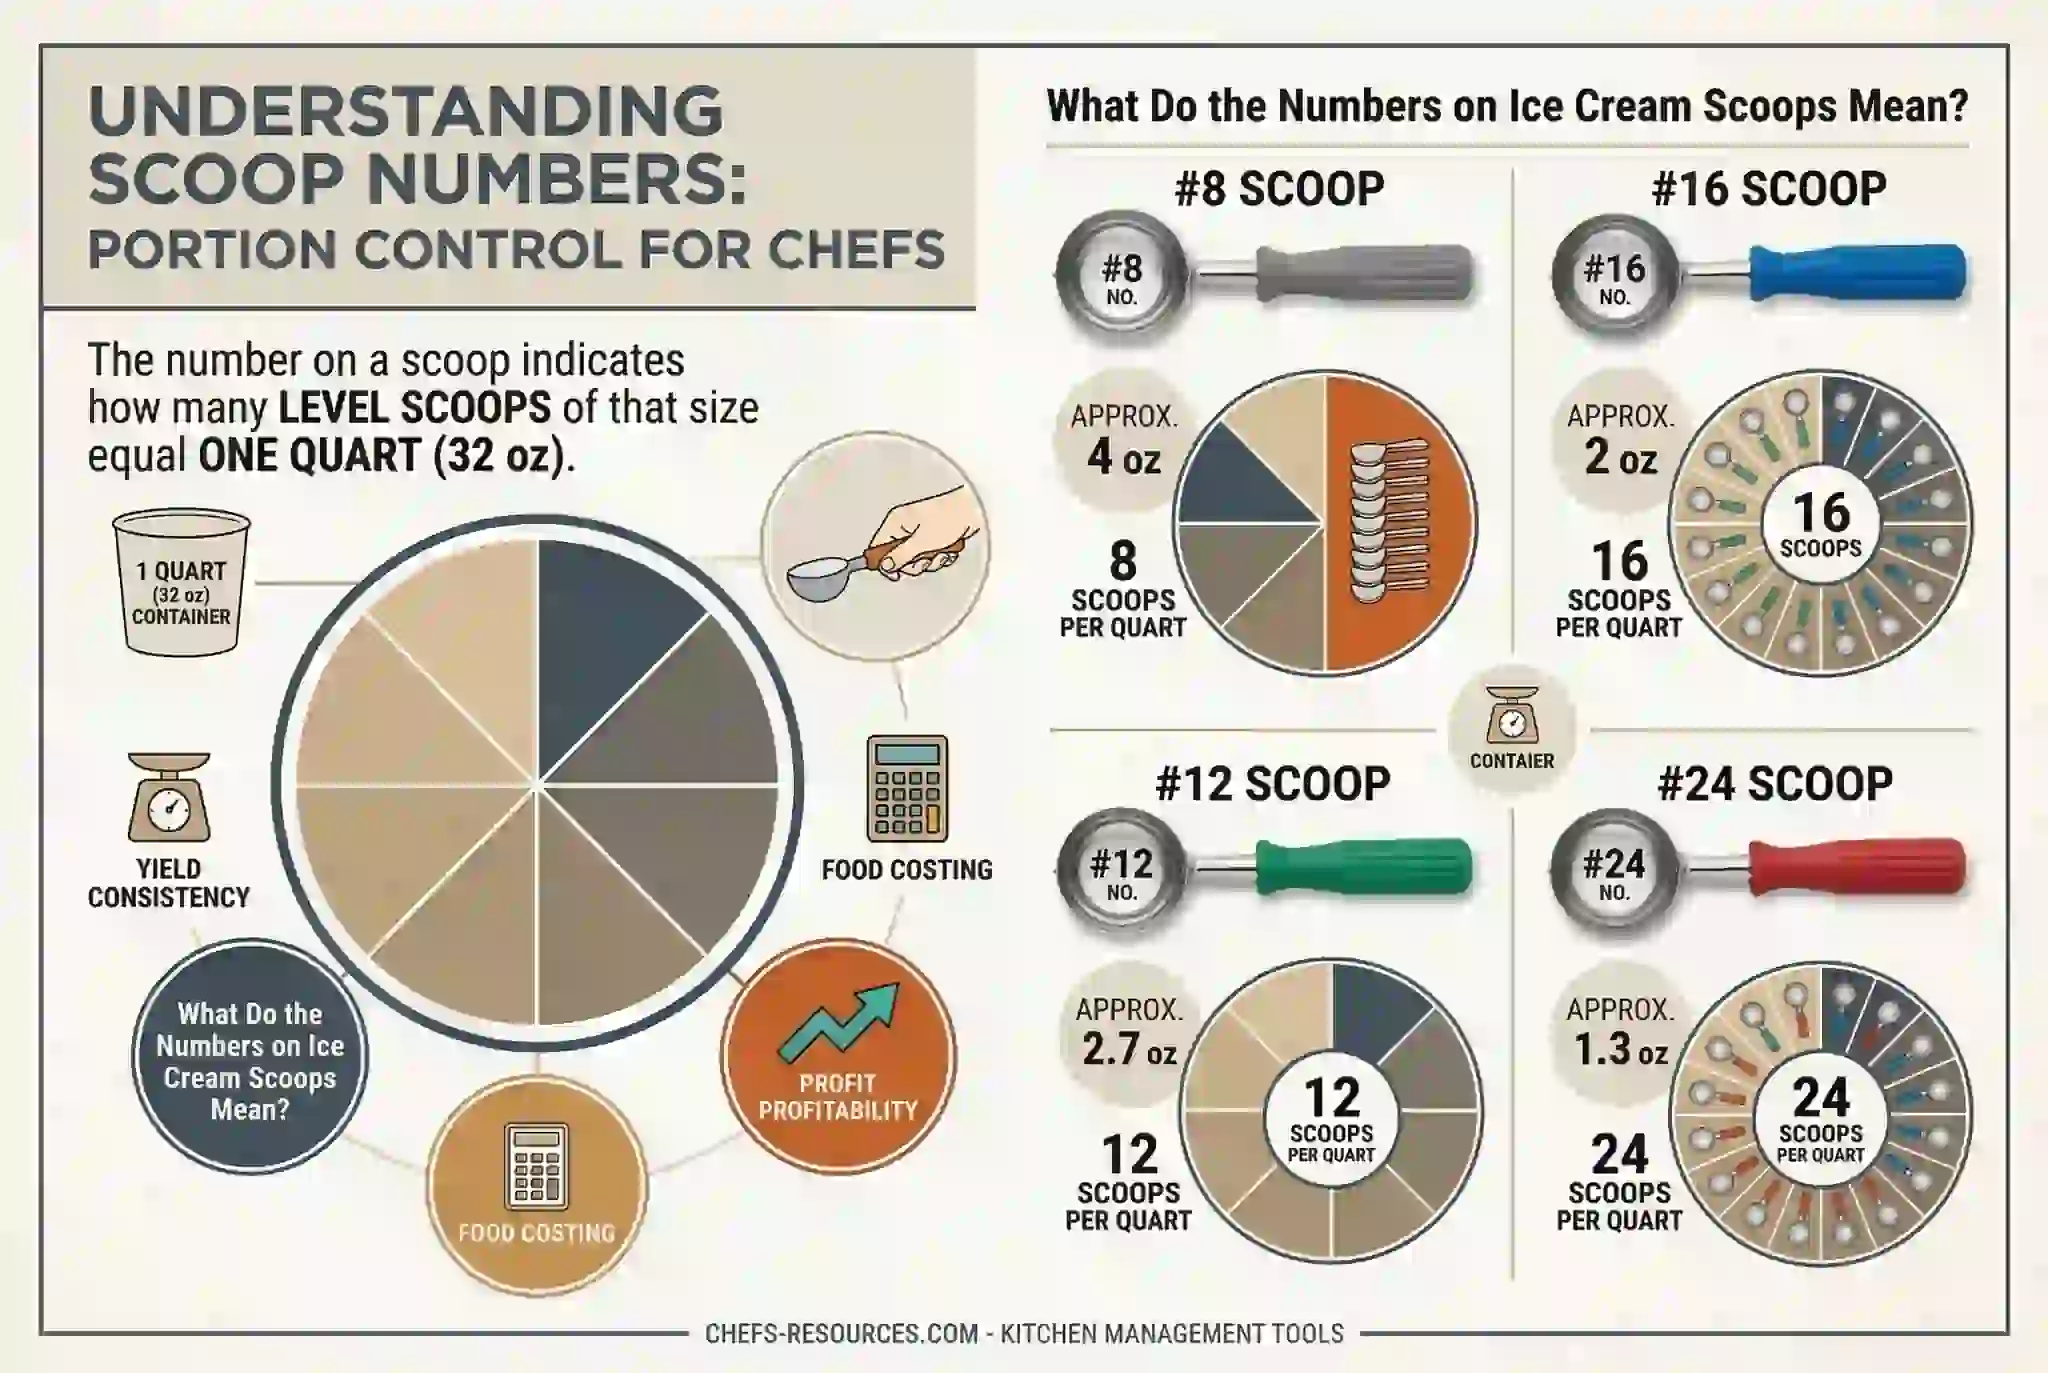
The number on your ice cream scoop is a portioning formula — not a size label. It tells you exactly how many level scoops fill a quart. Divide 32 by that number and you have your fluid ounce yield. A #16 gives you 2 ounces. A #8 gives you 4. That's the whole system.
What surprises us, after years of working inside commercial kitchen programs, is how rarely that system is actually understood by the people using it. We've walked into operations with a full set of color-coded dishers behind the counter and a team that couldn't tell you what a single number meant — or why it mattered. The result is predictable: portions that vary by staff member, food cost that drifts without explanation, and a margin problem that gets misdiagnosed for months.
Here we cut through that gap with a direct, kitchen-tested breakdown of what ice cream scoop size numbers mean, how the sizing system works from #4 through #100, and how to translate that knowledge into a portioning model that holds under real service conditions. Know the number. Control the portion. Protect the margin..
TL;DR Quick Answers
Ice Cream Scoop Numbers Explained
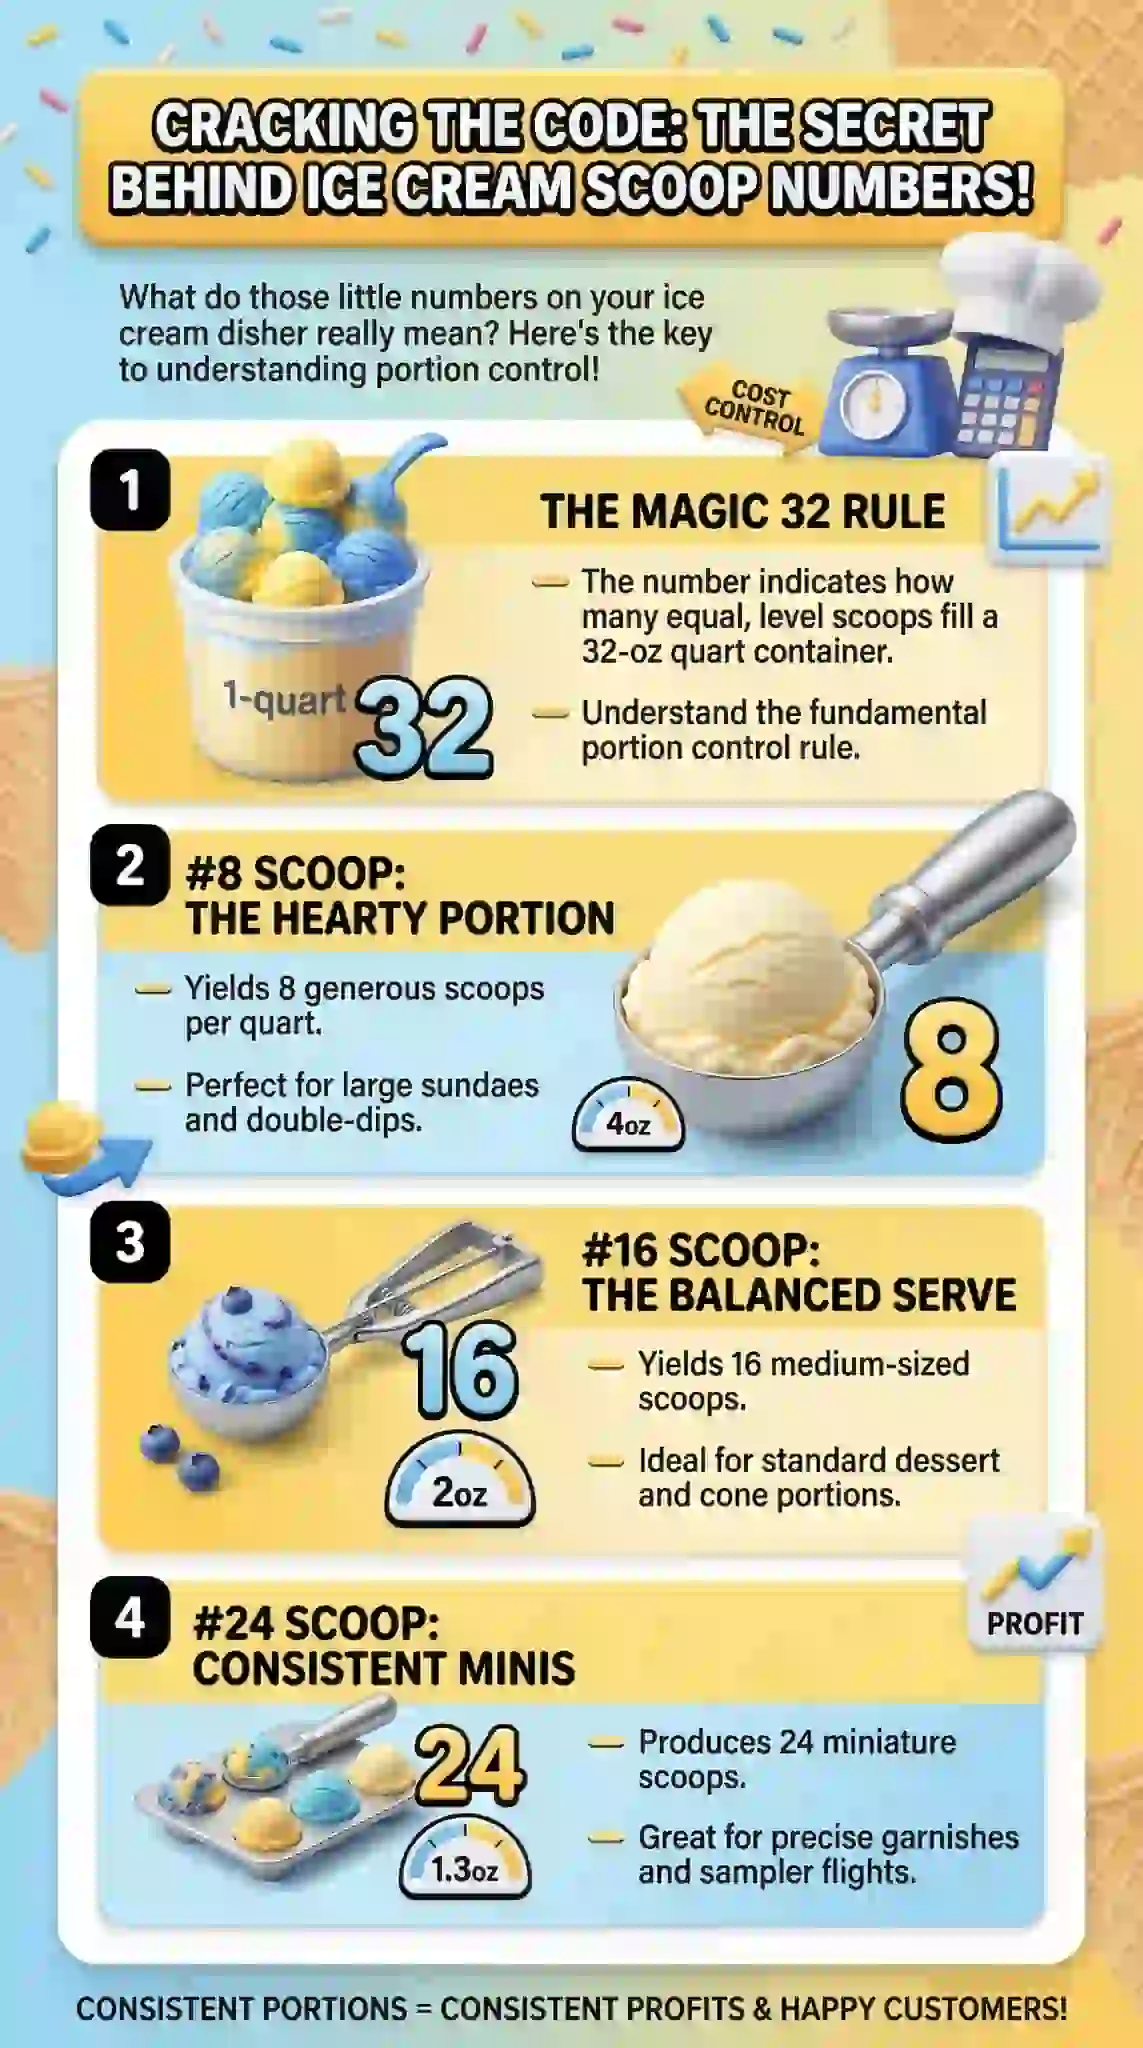
The number on an ice cream scoop is a portioning formula — not a size label. Here's the only rule you need:
32 ÷ scoop number = fluid ounces per portion
#8 = 4 oz — large single scoop, sundae builds
#10 = 3.2 oz — generous artisan-style portion
#12 = 2.67 oz — premium single-scoop presentations
#16 = 2 oz — commercial default, standard cone service
#20 = 1.6 oz — high-volume cost control
#24 = 1.33 oz — sample and kids' portions
#40 = 0.8 oz — mini portions, tasting applications
Higher number = smaller scoop. Always.
From years of working inside commercial operations, the operators who understand this formula make better portioning decisions, run tighter food costs, and build more consistent service teams. The ones who don't are managing a problem they can't see — one scoop at a time.
Three things to do with this information today:
Identify the scoop number currently in use for each menu item
Run the cost-per-portion math using 32 ÷ scoop number
Verify that number matches your price point and margin model
The formula is free. The system around it costs under $50 to build. The return shows up in the P&L within the first week of service.
Top Takeaways
The number on your scoop is a portioning formula, not a size label. Divide 32 by the scoop number to get fluid ounces per portion. Higher number = smaller scoop. Once that formula clicks, portion costing becomes simple math.
Most portioning problems are a knowledge gap — not a staffing problem. Teams produce inconsistent portions because nobody explained what the number means. The fix is education and system-building. Not personnel changes.
Every scoop number decision is a food cost decision. Food costs run a median of 32.4% of sales. Moving one scoop size shifts per-portion cost by 25 to 35%. At 250 scoops a day, that variance either holds your margin or erodes it — shift by shift.
Knowing the formula is step one. Using it consistently is where the money is. Build the system around it:
Color-code your dishers by size
Post a reference chart at the station
Audit portion weights monthly
Food costs are up 35% since 2019. Pre-tax margins sit at just 3 to 5%. There is no room left for undisciplined portioning. The scoop number system was built for high-volume environments where individual judgment breaks down under pressure. Use it as intended:
Assign numbers deliberately
Train your team on what they mean
Audit regularly
The cost to implement is minimal. The cost not to is compounding daily.
The Scoop Number Is a Portioning Formula, Not a Size Label
Every disher manufactured for commercial foodservice carries a number — and that number means one specific thing: how many level scoops it takes to fill a quart. A #10 scoops fills a quart in 10 scoops. A #24 fills it in 24. The math is built into the name. Once that principle lands, the entire sizing system becomes readable at a glance — and portion costing stops requiring a calculator.
The formula: 32 ÷ scoop number = fluid ounces per portion.
That single equation covers every standard disher in commercial use.
Higher Number, Smaller Scoop — Here's Why That Trips People Up
The most common point of confusion we encounter in kitchen settings is the inverse relationship between scoop number and portion size. Operators new to high-volume service often reach for a higher-numbered scoop expecting a larger yield. With clear kitchen management practices in place, this system becomes an advantage rather than a source of confusion. A #8 delivers 4 fluid ounces. A #40 delivers less than 1. The number reflects how many times the scoop fits into a quart — so the more times it fits, the smaller each portion must be.
Getting this relationship wrong doesn't just create confusion. It creates inconsistent portions across a service team that each think they're using the right tool.
The Complete Scoop Number Reference: #4 Through #100
From our kitchen testing and ongoing work with commercial operations, these are the sizes that matter most in day-to-day foodservice:
#4 — 8 oz — Large entrée and side dish portions
#6 — 5.33 oz — Generous dessert builds and large sides
#8 — 4 oz — Large single-scoop ice cream, sundae bases
#10 — 3.2 oz — Standard artisan ice cream portion
#12 — 2.67 oz — Premium single-scoop cone presentations
#16 — 2 oz — Commercial ice cream default, cookies, meatballs
#20 — 1.6 oz — Smaller portions, high-volume cost control
#24 — 1.33 oz — Appetizer and sample-size portions
#30 — 1.07 oz — Truffles, garnish, small batch applications
#40 — 0.8 oz — Falafel, mini cookies, petit four applications
#60 — 0.53 oz — Melon balls, plated garnish
#100 — 0.32 oz — Micro portions, butter service, fine garnish
What Handle Colors Tell You at a Glance
Commercial dishers use standardized handle colors so kitchen staff can grab the right size under pressure without checking numbers. This is one of the most underused systems in foodservice — and one of the fastest ways to eliminate portion drift across a team.
Gray — #8
Ivory — #10
Green — #12
Blue — #16
Yellow — #20
Red — #24
Black — #30
Orchid — #40
Post a color reference chart at your prep station. Train your team on it once. The portion consistency improvement is immediate.
How Scoop Numbers Connect to Food Cost
This is where the number on the scoop stops being a technical detail and starts being a financial one. Every time a staff member picks up a disher, they're making a cost decision — whether they know it or not, which is why many operations tie portion standards directly into a recipe template to keep serving sizes and costs consistent.
From our kitchen testing on a standard 3-gallon tub priced at $45:
Total yield: 384 fluid ounces
#10 scoop (3.2 oz) = $0.37 per portion
#12 scoop (2.67 oz) = $0.31 per portion
#16 scoop (2 oz) = $0.23 per portion
#8 scoop (4 oz) = $0.47 per portion
Moving one scoop size in either direction shifts your per-portion cost by 25 to 35 percent. At 250 scoops a day, that variance determines whether your food cost lands where your margin model requires — or quietly runs over it.
Volume vs. Weight: The Distinction That Matters for Costing
Scoop numbers measure volume — fluid ounces — not weight. This distinction becomes important the moment you start costing by the pound, which is how most ice cream is purchased. A #16 scoop holds 2 fluid ounces of product regardless of density. But 2 fluid ounces of dense premium ice cream weighs more than 2 fluid ounces of a lighter, higher-overrun product.
For precise food costing on high-volume items, weigh ten consecutive scoops of your specific product and divide by ten. That gives you actual weight per portion — the number your cost sheet needs, not the nominal volume on the disher.
Where Scoop Numbers Get Misapplied in Real Operations
After years of working with commercial kitchens, the misapplications we see most often aren't random — they follow predictable patterns:
Using a disher designed for soft products on hard-packed ice cream, wearing out the mechanism and drifting portions simultaneously
Selecting a scoop number based on what looks right in the hand rather than what the cost model requires
Running the same scoop number across different menu formats — a single-scoop cone and a two-scoop sundae build — without adjusting for vessel size or price point
Never auditing whether the scoop in use matches the scoop that was originally specified
Each of these errors is correctable in a single shift. None of them correct themselves.
"The number on the scoop is the most important piece of kitchen math most operators never learn. We've walked into operations running a full set of color-coded dishers — every size from #8 to #40 — and found a team that couldn't explain what a single number meant or how it connected to what was landing on the plate. That knowledge gap doesn't stay theoretical for long. It shows up in portions that vary by four, five, six staff members. It shows up in a food cost that drifts without a traceable cause. And it shows up in a P&L review where nobody in the room can explain why the numbers don't close. The fix is one equation: 32 divided by the scoop number equals your fluid ounce yield. Know that, build your cost model around it, and the scoop stops being a mystery tool and starts being the most reliable portion control system in your kitchen."
Essential Resources
After years of watching kitchens misread the number on a scoop — and pay for it in food cost drift — we put this list together. These are the resources that actually close the knowledge gap, whether you're setting up your first portioning system or auditing one that's stopped making sense.
1. The Only Disher Number Chart Worth Printing and Posting at Your Station This is the reference we keep coming back to. Every scoop number from #4 through #100, with fluid ounce yields, tablespoon equivalents, and scoops-per-cup — all verified against manufacturer specs and our own kitchen testing. Download it, laminate it, tape it inside your reach-in door. It pays for the five minutes it takes to set up every single service. https://www.chefs-resources.com/culinary-conversions-calculators-and-capacities/scoop-disher-sizes/
2. Scoop Numbers, Handle Colors, and Tool Types — Know All Three Before You Buy Using the wrong tool costs you equipment life and portion consistency simultaneously. WebstaurantStore's buying guide covers how disher numbers map to handle colors, what separates a disher from a true ice cream scoop, and what material considerations matter most in high-volume service. Read it before you standardize equipment across your operation. https://www.webstaurantstore.com/guide/717/kitchen-scoop-and-disher-guide.html
3. The Federal Reference Standard That Auditors Actually Recognize If you're running a school nutrition program, healthcare foodservice, or any operation where portion compliance gets documented and reviewed, this is the source you cite — not a blog post, not a manufacturer's spec sheet. The USDA's Table 13 is the government benchmark for disher capacity. That's the beginning and end of the conversation. https://foodbuyingguide.fns.usda.gov/Content/TablesFBG/Table13_FBG_Sizes_and_Capacities_of_Scoop_s_(or_Dishers).pdf
4. Turn Scoop Numbers Into a Staff Training Tool Your Team Can Actually Use Under Pressure Knowing the number is step one. Knowing which number goes with which product is where most kitchens fall apart during service. Gygi's application guide pairs each disher number to real product uses across ice cream, baking, and prep — the kind of reference that works as a station chart your team can read in two seconds, not two minutes. https://gygi.com/blogs/create/food-disher-sizing
5. Why Ice Cream Scoop Numbers Work the Way They Do — The Technical History Behind the System We've found that operators who understand the origin of the quart-fraction numbering system make better portioning decisions than those who simply memorize the chart. Wikipedia's scoop reference covers the technical distinction between dishers, true ice cream scoops, and transfer scoops — and explains why different tool types follow different sizing conventions. Know the system before you build a standard around it. https://en.wikipedia.org/wiki/Scoop_(utensil)
6. The Step That Connects Your Scoop Number to What It Actually Costs Per Serving Here's what most portioning conversations miss: the scoop number is only useful once it's connected to a cost model. The Culinary Pro's food cost guide walks through plate cost calculation, food cost percentage, and menu pricing strategy with enough precision to turn a disher decision into a real margin number. This is the missing link between the chart on your station and the P&L on your desk. https://www.theculinarypro.com/calculating-food-cost
7. The Operational Foundation Every Scoop Number Decision Should Be Built On Before you assign a number to any menu item, you need to understand standardized portions, yield testing, and how standard portion cost connects to your food cost percentage. This open-access foodservice management resource covers all of it clearly and without the noise. Read it once and the relationship between your disher and your bottom line stops being a mystery. https://opentextbc.ca/basickitchenandfoodservicemanagement/chapter/controlling-food-costs/
Supporting Statistics
Stat #1: Food and Beverage Costs Represent a Median of 32.4% of Sales for Limited-Service Operators
After years inside commercial kitchens, the food cost conversation almost always starts in the wrong place. Operators look at purchasing. Supplier pricing. Menu mix. The scoop at the prep station rarely comes up — until the numbers stop closing.
The NRA's 2025 Restaurant Operations Data Abstract — drawn from 900+ operators — puts food and beverage costs at a median of 32.4% of sales for limited-service operators in 2024 National Restaurant Association
Nearly one-third of every revenue dollar is consumed before a customer walks in
At that ratio, portioning is one of the highest-leverage cost controls available
In most kitchens, it's the one being managed with the least structure
The scoop number isn't a minor detail. It's sitting at the center of the most controllable line item on the P&L.
Source: National Restaurant Association — Restaurant Operators Kept Food Cost Ratios in Check in 2024 https://restaurant.org/research-and-media/research/restaurant-economic-insights/analysis-commentary/restaurant-operators-kept-food-cost-ratios-in-check-in-2024/
Stat #2: Higher-Volume Operators Run Nearly 3 Points Lower Food Cost — and It Shows Directly in Pre-Tax Profit
The kitchens we've seen run the tightest margins share one trait: they've systematized the decisions most operators leave to individual judgment. Scoop size is one of those decisions.
Fullservice operators above $2M in sales reported median food costs of 31.0% in 2024 — nearly 3 points below the 33.7% median for operators below that threshold National Restaurant Association
That gap flowed directly to the bottom line: higher-volume operators posted median pre-tax income of 4.3% of sales versus just 1.1% for lower-volume counterparts National Restaurant Association
We've watched that variance play out at the kitchen level repeatedly. The difference between 31% and 34% food cost isn't always sourcing or menu engineering. It's often portioning discipline:
Knowing what the number on the disher means
Assigning the right size to the right product
Holding that standard across every shift
Source: National Restaurant Association — Higher Volume Restaurants Reported Lower Food Cost Ratios in 2024 https://www.restaurant.org/research-and-media/research/restaurant-economic-insights/analysis-commentary/higher-volume-restaurants-reported-lower-food-cost-ratios-in-2024/
Stat #3: Food and Labor Costs Have Each Risen 35% Since 2019 — Leaving Most Operators a 3–5% Pre-Tax Margin
The margin environment right now is the tightest we've seen in decades of commercial kitchen work. The data makes the stakes impossible to ignore.
The NRA reports food and labor costs have each risen 35% over the past five years National Restaurant Association
The average restaurant operates on a pre-tax margin of just 3 to 5% of sales National Restaurant Association
A scoop running half an ounce heavy across 250 daily portions isn't a rounding error
It's a weekly food cost leak compounding against a margin with almost no room left
There is no buffer for undisciplined portioning at these margins. Understanding the number on your disher isn't kitchen trivia. It's the foundation of a cost model that either holds — or quietly doesn't — one scoop at a time.
Source: National Restaurant Association — Inflation and Restaurant Cost Pressures https://restaurant.org/research-and-media/research/inflation/
Final Thoughts & Opinion
After years inside commercial kitchen operations, one pattern repeats itself: the number on the ice cream scoop is some of the most consequential kitchen math that almost nobody bothers to learn. Not because it's complicated. Because it looks simple enough that operators assume it's already understood — then build an entire portioning system on that assumption without ever verifying it.
That assumption is expensive.
The formula takes ten seconds to explain. Divide 32 by the scoop number and you have your fluid ounce yield. What takes longer — and what costs operators real money — is the gap between knowing the formula and building a system that holds under real service conditions, across different staff, different shifts, and different levels of rush pressure.
What the Data Tells Us
Food costs consume a median of 32.4% of every sales dollar in limited-service operations
Operators who manage portions tightly run nearly 3 points lower food cost — visible directly in pre-tax profit
Food costs have risen 35% since 2019, leaving most operators just 3 to 5% pre-tax margin
A half-ounce of drift across 250 daily scoops is not a rounding error — it's a structural problem
What We've Seen Firsthand
Kitchens running the wrong scoop number for months because nobody connected the disher to the cost model at launch
Four staff members using the same scoop, producing four different portions — because nobody explained what the number meant or how to use it level
Operators who solved a persistent food cost problem in a single shift once they audited actual portion weights
Color-coded disher sets and a laminated station chart eliminating drift that had been misdiagnosed as a purchasing problem for an entire quarter
Our Take
The scoop number system exists because high-volume foodservice needs portioning that is consistent, teachable, and auditable under pressure. It works — but only when the people using it understand what the number means.
Build the system around it:
Assign the correct scoop number to each menu item
Color-code your tools and post a chart at the station
Audit portion weights monthly
The investment is minimal. The return shows up in the P&L within the first week. The scoop behind your counter stops being a mystery tool and becomes the most reliable cost control system in your kitchen — the same kind of disciplined portion control and measurement mindset that successful organic farming operations rely on to manage yield, consistency, and profitability.
FAQ on What the Numbers on Ice Cream Scoops Mean
Q: What does the number on an ice cream scoop actually mean? A: It's a portioning formula built into the tool. The number = how many level scoops fill a quart (32 fluid ounces). The formula: 32 ÷ scoop number = fluid ounces per portion.
#8 scoop = 4 oz per portion
#12 scoop = 2.67 oz per portion
#16 scoop = 2 oz per portion
#20 scoop = 1.6 oz per portion
After years in commercial kitchens, we've walked into operations where nobody on the floor could explain what the number meant — and the portions showed it. Post the formula at the station. The consistency improvement is immediate.
Q: Why do higher scoop numbers mean smaller portions? A: The number reflects how many times the scoop fits into a quart. More fits = smaller each portion must be. It runs opposite to what most people expect.
#6 scoop = fits 6 times per quart = 5.33 oz per portion
#16 scoop = fits 16 times per quart = 2 oz per portion
#40 scoop = fits 40 times per quart = 0.8 oz per portion
We've seen this confusion cause real damage — staff grabbing higher-numbered scoops thinking they were portioning larger, with nobody catching the error until a food cost review surfaced weeks of drift. The inverse relationship needs to be taught explicitly. Never assumed.
Q: What do the handle colors on ice cream scoops mean? A: A standardized identification system that most kitchens dramatically underuse. Each color maps to a specific scoop number:
Gray — #8 (4 oz)
Ivory — #10 (3.2 oz)
Green — #12 (2.67 oz)
Blue — #16 (2 oz)
Yellow — #20 (1.6 oz)
Red — #24 (1.33 oz)
Black — #30 (1.07 oz)
Orchid — #40 (0.8 oz)
The system exists so staff grab the right tool under pressure without reading numbers during a rush. Post a color chart at the prep station. Train the team once. It takes five minutes to set up and eliminates more portion drift than most formal training programs do.
Q: How do I use the scoop number to calculate food cost per portion? A: Three steps used in kitchen cost work every time:
Divide 32 by scoop number → fluid ounces per portion
Divide total product cost by total fluid ounces → cost per ounce
Multiply cost per ounce by scoop's fluid ounce yield → cost per portion
Real numbers from our kitchen testing on a 3-gallon tub at $45 (384 fluid ounces / $0.117 per oz):
#16 scoop (2 oz) = $0.23 per portion
#12 scoop (2.67 oz) = $0.31 per portion
#10 scoop (3.2 oz) = $0.37 per portion
That's a 61% cost increase per serving between a #16 and a #10 — with no menu price adjustment. Run the math before standardizing on any size.
Q: Does the scoop number measure weight or volume — and why does it matter for food costing? A: Volume — fluid ounces. Not weight. That distinction has caught out more operators than we can count. Most ice cream is purchased by the pound. A #16 holds 2 fluid ounces regardless of product density — but actual weight varies by product.
From our kitchen testing per #16 scoop:
Dense premium ice cream — approximately 2.4 oz by weight
Lighter high-overrun product — approximately 1.8 oz by weight
That variance matters when costing by weight at scale. Our standing recommendation:
Weigh ten consecutive scoops of your specific product
Divide by ten
Use that number — not the nominal volume on the handle — as your portion weight for cost sheet calculations